
Insights Dashboard
The Insights dashboard contains detailed information about player activity on your Fortnite Creative islands. Learn more about the number of players who play on your islands and return to play more, and the amount of time players spend on your islands.
How It Works
Island data is pulled daily to give you an in-depth look at the number of visiting players, how long players typically stick on your islands, and how many return. You can see your top performing islands and the number of new players, as well as weekly and monthly data.
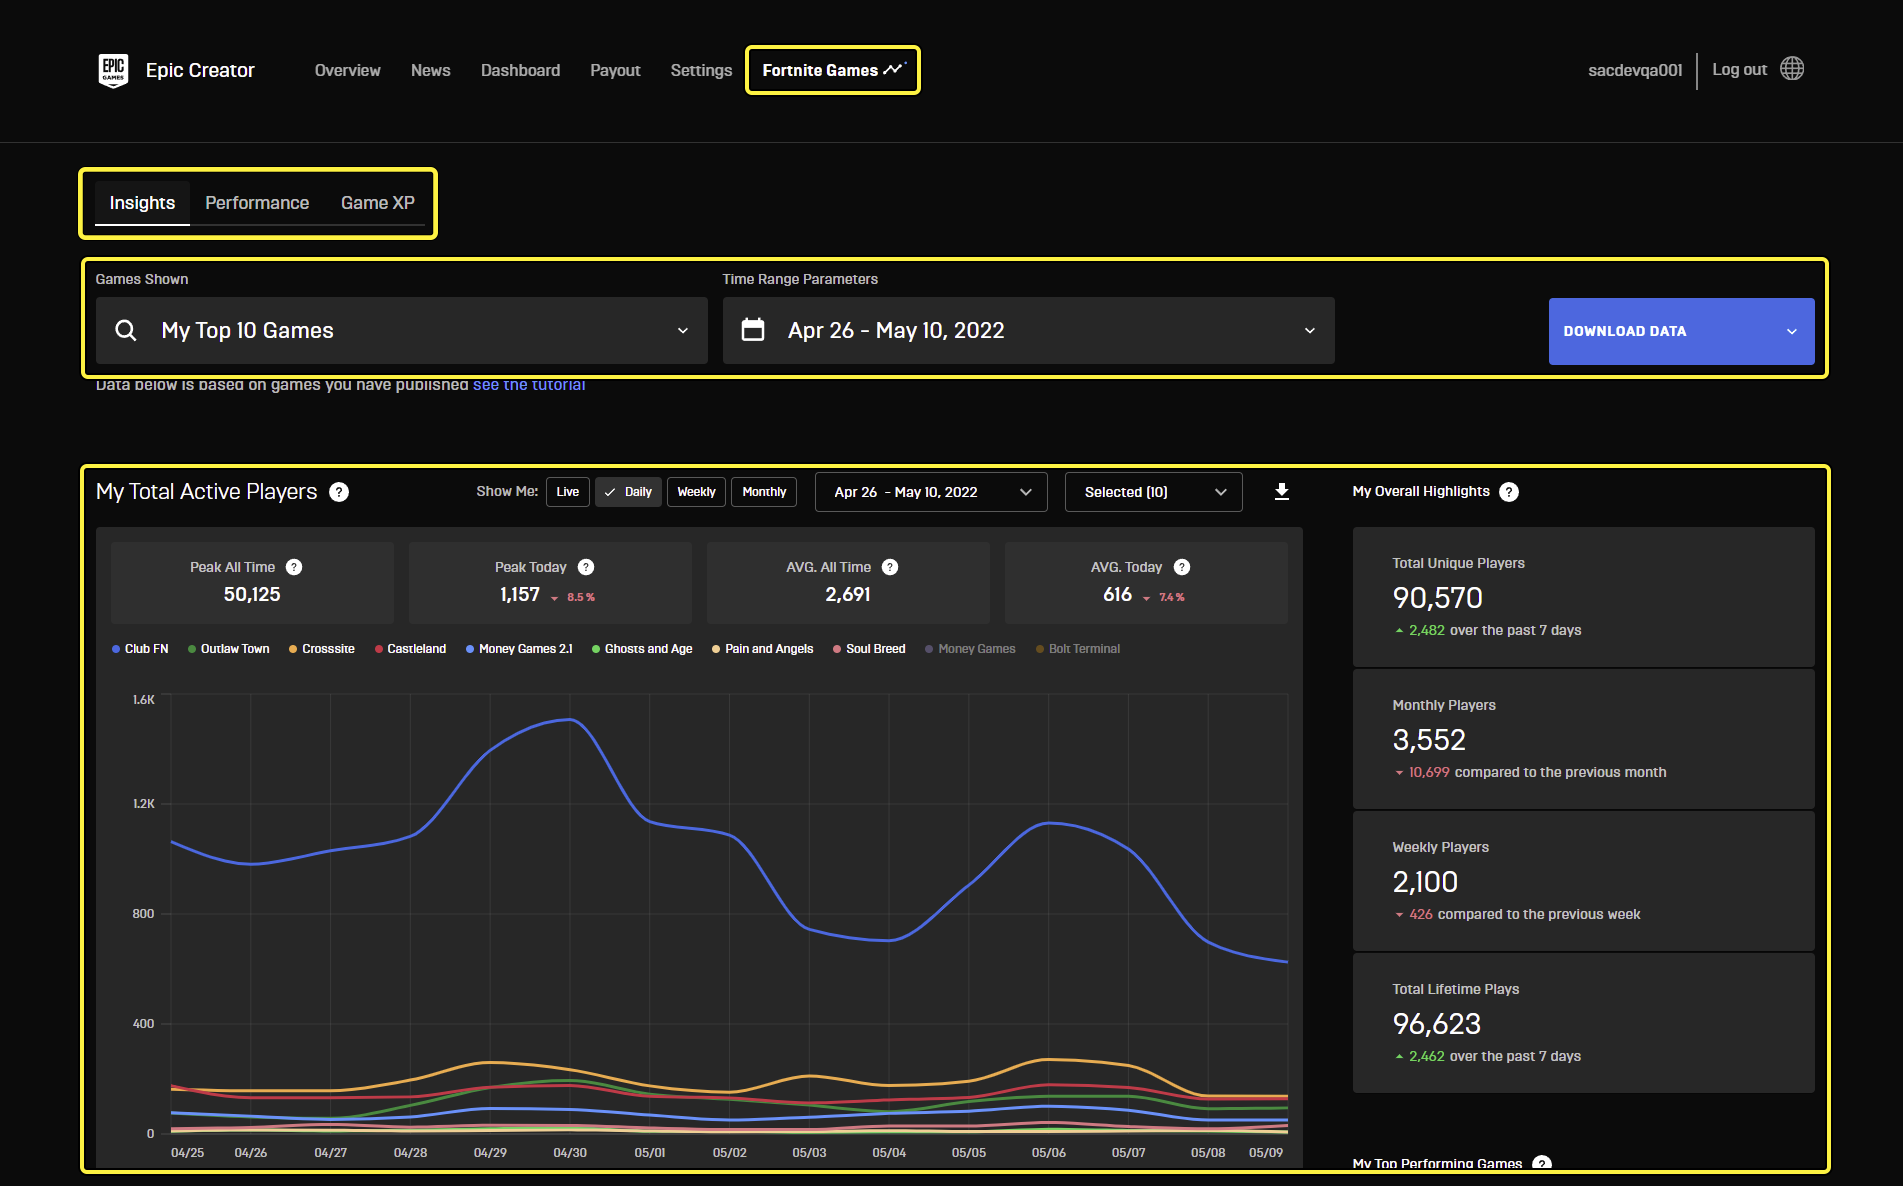
Set the data you want to see in a number of ways, first by selecting the game view under Games Shown and the date range under Time Range Parameters.
Game Shown
| Selectors |
|---|
| Selected Games |
| Recently Published |
| My Top 10 games |
| My Top 10 Trending Games |
Time Range Parameters
| Player Data | Time Range |
|---|---|
| Daily | Last 7 days |
| Weekly | Last 7 days |
| Monthly | Last month Last 3 months Select Time Range |
Time Range Parameters are a common feature across multiple graphs. Use the Time Range Parameters to set the time frame you want to analyze by selecting from Live data, Daily data, Weekly data, or Monthly data. You can also select the dates you want to view island information for from the month dropdown menu. The default is always set to the current date.
You're reading a preview
The full reference is free for BrainDeadGuild Discord members — sign in to read it all, or open the original at the source.
Sign in with your BrainDead.TV / BrainDeadGuild Discord account for full access.