
Project Analytics In Fortnite Creative
The new Analytics section for each project gives creators and their teams insight into the players their games attract and garner, and the player levels of engagement.
This helps creators understand everything from how compelling a thumbnail is to how sticky their experiences are.
Metrics in Project Analytics are grouped thematically around the type of insight they provide, and nested within different sections of mini-tabs. These may shift around in the future as the metrics provided continue to grow and iterate.
All data under the Analytics tab is available to team members with an Owner, Administrator or Publisher role. Collaborators and Play testers will not have access.
Audience Tab
Use this tab to understand how many potential players your island is attracting and converting to plays.
Impressions
This tab shows Impressions, or the number of times your island was displayed to players.
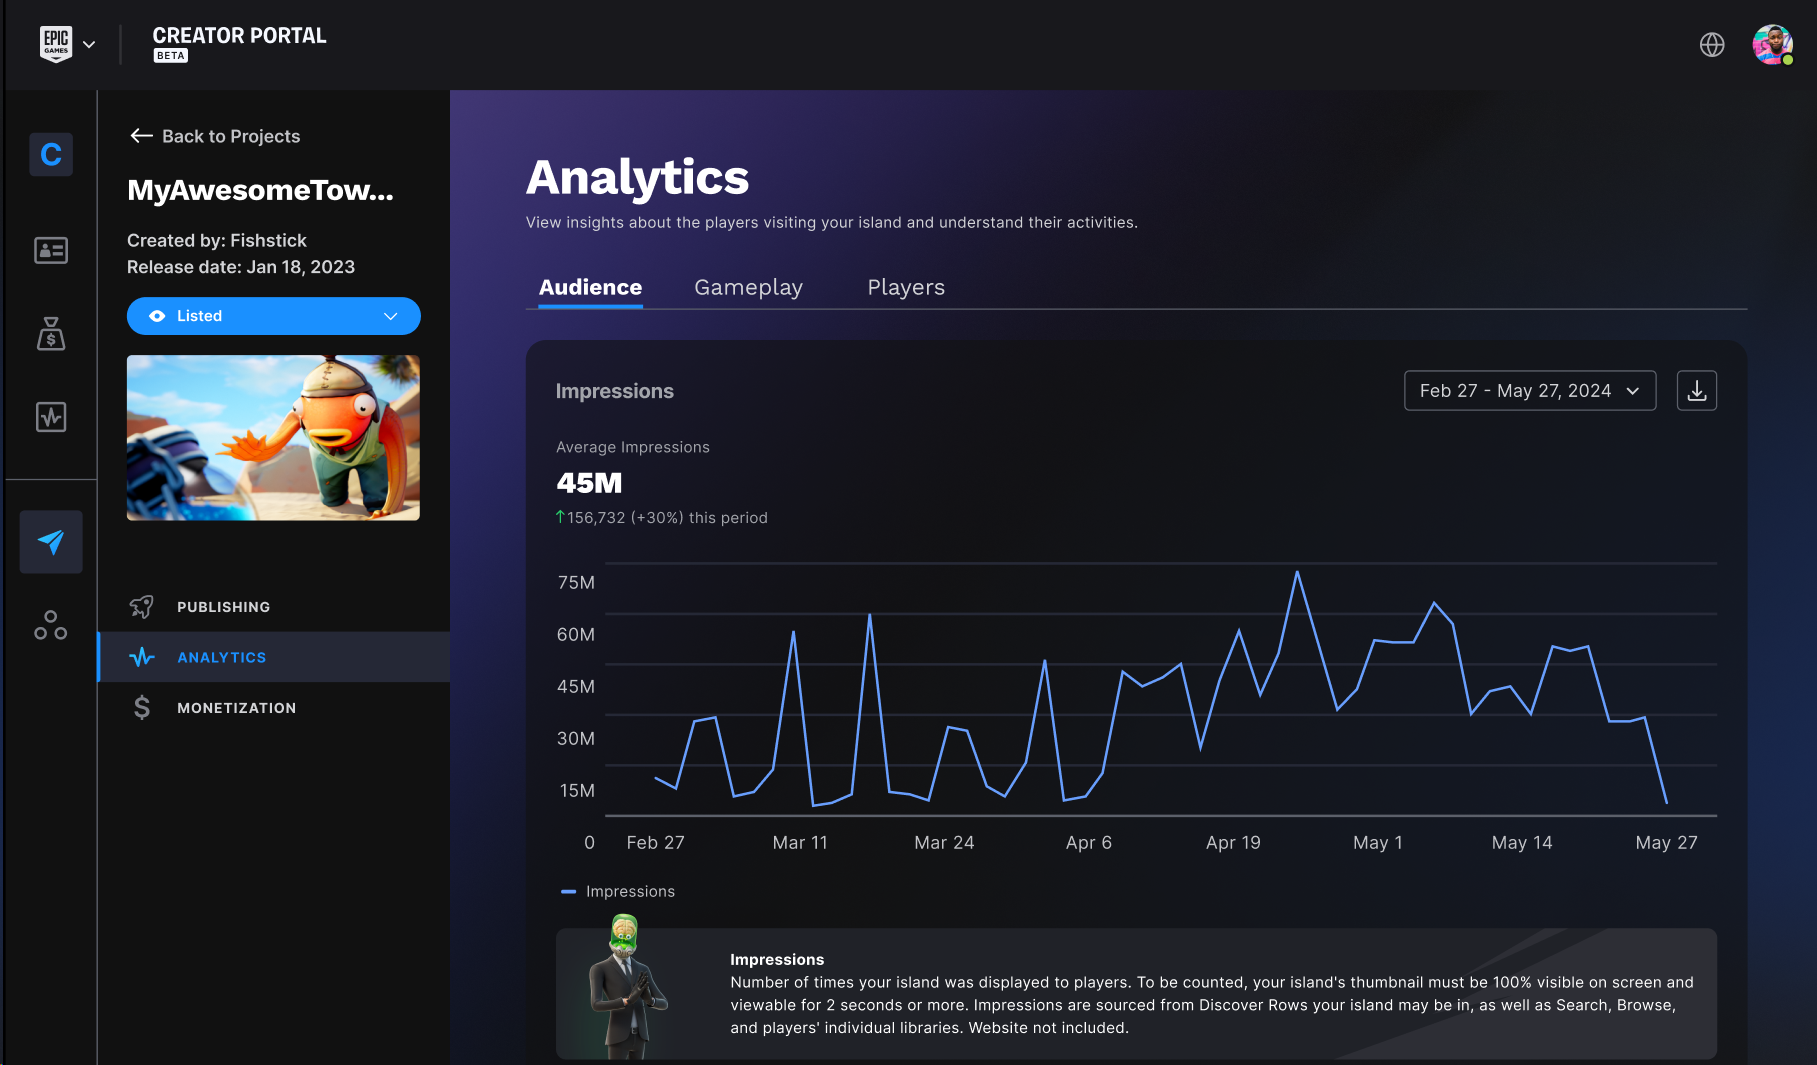
These impressions are sourced from any Discover Rows your island may be in, Search, Browse, and players' individual libraries. (The Fortnite.com website is currently not included in this data.) To be counted, your island's thumbnail must be 100% visible on screen and viewable for 2 seconds or more.
You're reading a preview
The full reference is free for BrainDeadGuild Discord members — sign in to read it all, or open the original at the source.
Sign in with your BrainDead.TV / BrainDeadGuild Discord account for full access.